

✦ 這篇筆記帶你看
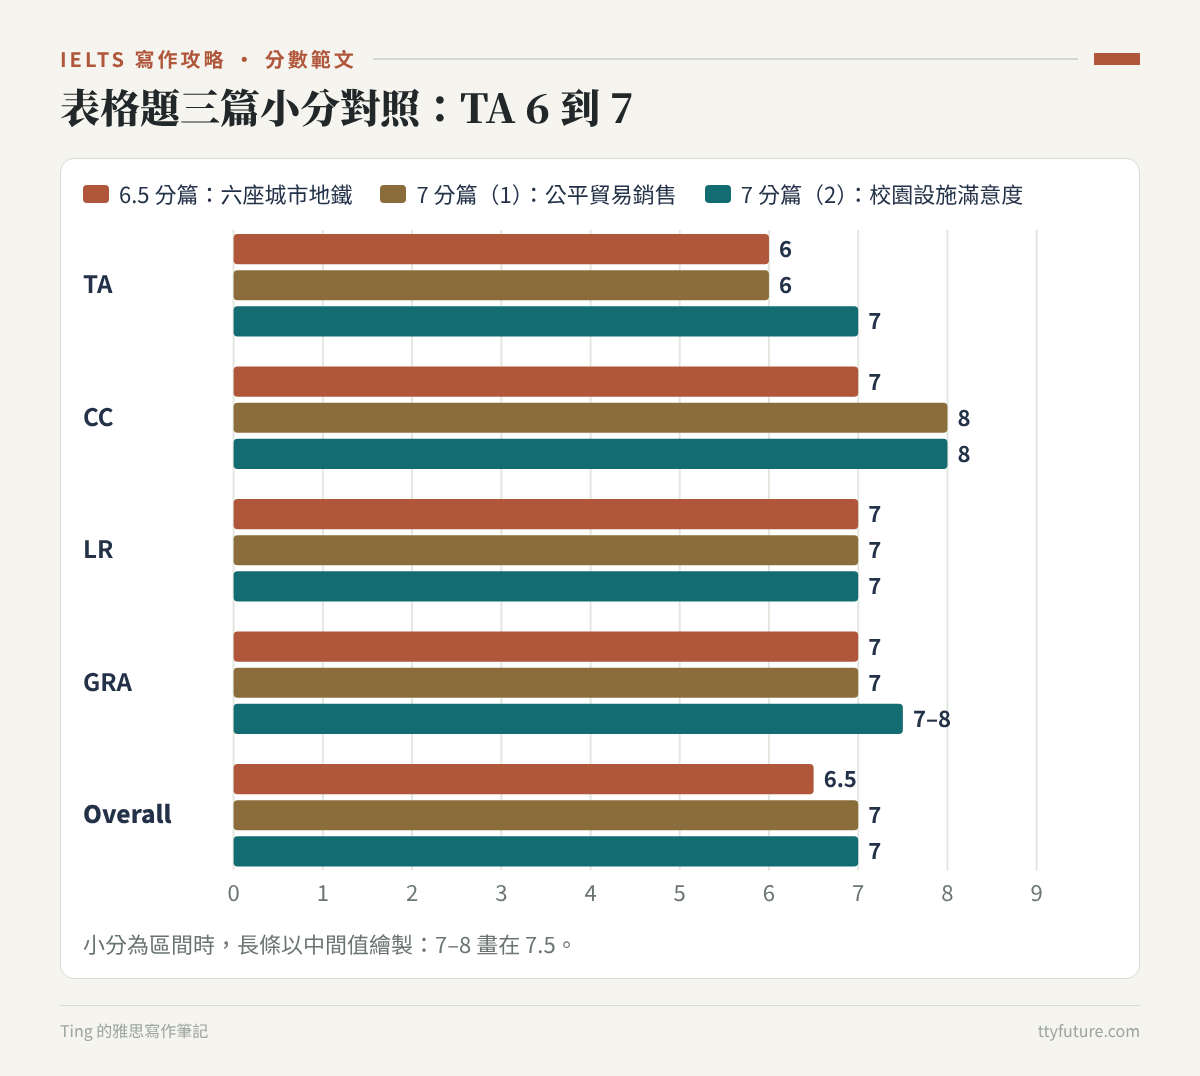
2024 年 6 月 13 日,我同一天寫了兩篇表格題送去批改。寫完第一篇地鐵系統之後,我在作文最後附了一個問題給批改老師,大意是:「表格和圖表的細節這麼多,要怎麼寫得精簡?我很難判斷哪些才是重要的數據。」
這個問題我想很多人都有。表格題不像折線圖有明顯的線條走勢,也不像圓餅圖只有幾塊,它是一整片數字,每一格看起來都一樣重要。那兩篇的分數是:地鐵 6.5 分、公平貿易 7 分,但兩篇的 Task Achievement(TA)都只有 6。三個禮拜後(07/02)我寫了一篇大學設施滿意度的表格題,TA 終於拿到 7。
這篇把三篇原文放在一起,原封不動貼出(保留錯字和文法錯誤,作文後面的提問不屬於作文本體,所以沒有貼)。分數原因是我自己對照 IELTS 公開評分標準(band descriptors)的分析,也順便用這三篇回答我自己當時的問題:表格題的重點到底怎麼挑。
一、先看結論:表格題 6 分和 7 分差在哪
| 比較項目 | 地鐵(TA 6) | 公平貿易(TA 6) | 滿意度(TA 7) |
|---|---|---|---|
| Overview | 正確,抓到最老、最長、最多人、最短 | 正確,但只講漲跌方向,沒講規模 | 正確,點出滿意與不滿意的對比 |
| 涵蓋度 | 整個城市(華盛頓)沒出現,倫敦的乘客數也沒寫 | 五國兩種商品全部寫到 | 三種設施都寫到,學習設施用範圍概括 |
| 數字準確度 | 全對,但有一句邏輯矛盾(1900 年算不算之後) | 全對 | 一個數字錯(35 寫成 30),一個「超過 85%」不精確 |
| 跨欄比較 | 沒有,一欄一段、各自列前二後二 | 沒有比較國家之間的規模差距 | 有比較大學部與研究生的差異 |
對照評分標準,TA 6 是「有 Overview,資訊選擇大致恰當,但細節可能不相關或不準確」,TA 7 是「清楚呈現主要特徵和差異」。表格題從 6 到 7,關鍵常常不是「數字對不對」——地鐵和公平貿易兩篇的數字幾乎全對——而是有沒有選出真正的重點,並且做出比較。
二、6.5 分篇:六座城市的地鐵系統(TA 6)
題目在考什麼
這題是網路題庫的表格練習,我寫在 2024/06/13,原文沒有記時間,正文大約 220 字。表格列出六座城市(倫敦、巴黎、東京、華盛頓、京都、洛杉磯)地鐵系統的三項資料:開通年份、路線長度(公里)、每年乘客數(百萬人次)。
| 城市 | 開通 | 長度(km) | 年乘客(百萬) |
|---|---|---|---|
| 倫敦 | 1863 | 394 | 775 |
| 巴黎 | 1900 | 199 | 1191 |
| 東京 | 1927 | 155 | 1927 |
| 華盛頓 | 1976 | 126 | 144 |
| 京都 | 1981 | 11 | 45 |
| 洛杉磯 | 2001 | 28 | 50 |
這張表最有意思的地方不在任何一欄的第一名,而在欄與欄之間的落差:倫敦最老、路線最長,乘客卻只排第三;東京路線比巴黎短,乘客卻最多。另一個大方向是:越早開通的系統,通常越長、越多人搭;1970 年代以後開通的三個系統,乘客都不到 1.5 億。
分數卡
原文
以下為送出批改的原始版本,未修改(錯字、文法錯誤都保留)。
The given table illustrates the comparisons regarding underground railway systems in six selected cities. Overall, London is the city which has oldest and longest underground system, and the system in Tokyo has biggest number of passengers. In contrast, the shortest system is in Kyoto, which has less number of users as well.
Regarding open date, most cities started to have underground railway system after 1900, except London, a city that underground system opened in 1863. After that, Paris and Tokyo started to open their systems in 1900 and 1927, respectively; the system in Los Angeles is the newest one, which opened in 2001.
As for the length of underground railway, with the figure for 394 kilometers and 199 kilometers, the underground railway in London and Paris have the longest and second longest route. The system in Kyoto and Los Angeles, on the contrary, has the shortest one and second shortest one, with 11 kilometers and 28 kilometers, respectively.
Moving to the number of users, two of them have more than 1000 million passengers annually. Tokyo, which has 1927 million commuters, and Paris, which has 1191 million travelers, are the busiest ones. Conversely, with only 45 million and 50 million passengers, not only Kyoto but also Los Angeles do not have that many users in comparison with that in other cities.
這篇為什麼拿到 6.5 分
Task Achievement 6:Overview 正確,但整個城市被漏掉,而且沒有跨欄比較。先說做對的:Overview London is the city which has oldest and longest underground system, and the system in Tokyo has biggest number of passengers,再加上京都最短、乘客最少,四個判斷全對,而且每個都是表格裡的極值。所有寫出來的數字也都正確。
問題在於「選擇」:
- 華盛頓從頭到尾沒出現。六座城市漏掉一座,等於六分之一的資料不見了。它的數字雖然不是極值(1976 年、126 公里、1.44 億人次),但它其實很關鍵:它的路線長度接近東京,乘客卻不到東京的十分之一。
- 倫敦的乘客數沒寫。Overview 說倫敦最老最長,乘客那段卻只寫最多和最少的城市,倫敦的 775 百萬人次被跳過。這剛好是全表最值得講的對比之一:最長的系統,乘客卻不是最多。
- 一欄一段,各寫前二後二。開通年份一段、長度一段、乘客一段,每段都是「最大的兩個、最小的兩個」。看起來很有系統,但三段之間沒有任何連結,讀者看不出「年份」和「長度、乘客」有什麼關係。這也是為什麼華盛頓會被漏掉:它在每一欄都排中間,用「前二後二」的篩法永遠篩不到它。
- 一個小矛盾。most cities started to have underground railway system after 1900, except London,但下一句說巴黎 1900 年開通,1900 年不算 after 1900。改成 in or after 1900 就好。
這些問題合起來,就是 TA 6 的樣子:有 Overview、數字對、選擇大致合理,但關鍵特徵沒有被充分凸顯,某些資料還被遺漏。
Coherence & Cohesion 7:三段各有清楚的主題(Regarding open date、As for the length、Moving to the number of users),段內順序也一致。扣分的是段與段之間沒有關聯,還有 not only Kyoto but also Los Angeles do not have that many users 這種把 not only … but also 用在否定句的不自然結構,以及 in comparison with that in other cities 的 that 指涉不清(應為 those)。
Lexical Resource 7:乘客的說法有變化(passengers、commuters、travelers、users),the busiest ones 也很道地。錯誤是 less number of users(應為 fewer users 或 a smaller number of users)、with the figure for 394 kilometers(應為 with figures of)。
Grammatical Range & Accuracy 7:關係子句用得多,錯誤包括 a city that underground system opened in 1863(應為 whose)、has oldest and longest、has biggest number(最高級少了 the)、The system in Kyoto and Los Angeles … has(兩個系統要用複數)。
三、7 分篇(1):公平貿易咖啡與香蕉銷售(TA 6、CC 8)
題目在考什麼
這題也是網路題庫的練習,跟地鐵那篇同一天(2024/06/13)寫的,原文沒有記時間,正文大約 190 字。題目是兩個表格,分別列出英國、瑞士、丹麥、比利時、瑞典五個歐洲國家,1999 年和 2004 年公平貿易標章咖啡和香蕉的銷售額(單位:百萬歐元)。
| 國家 | 咖啡 1999 → 2004 | 香蕉 1999 → 2004 |
|---|---|---|
| 英國 | 1.5 → 20 | 15 → 47 |
| 瑞士 | 3 → 6 | 1 → 5.5 |
| 丹麥 | 1.8 → 2 | 0.6 → 4 |
| 比利時 | 1 → 1.7 | 1.8 → 1 |
| 瑞典 | 0.8 → 1 | 2 → 0.9 |
關鍵特徵有兩層。第一層是方向:咖啡五國都上升,香蕉三國上升、比利時和瑞典下降。第二層是規模:英國在 2004 年兩種商品都遠遠領先,咖啡 20 是第二名瑞士的三倍多,香蕉 47 更是其他四國加起來的四倍以上;而且 1999 年咖啡最多的是瑞士,英國是後來居上。
分數卡
原文
以下為送出批改的原始版本,未修改(錯字、文法錯誤都保留)。
The given tables compare the data regarding the income of coffee and bananas which have Fairtrade-labelled over the years 1999 and 2004 in five nations in Europe. Overall, the sales of coffee in all selected countries increased from 1999 to 2004. In contrast, the bananas’ sales rose in most of countries except Belgium and Sweden.
Regarding the sales of coffee, UK experienced a biggest growth from 1.5 million euros to 20 million. Besides that, doubled the amount in 1999, Switzerland sold 6 million coffee in 2004. Conversely, as for the sales in Denmark, Belgium, and Sweden, all of them witnessed a slight increase, with the figure for 2 million, 1.7 million, and 1 million in 2004, respectively.
Moving to the bananas’ sales, the number in UK in 2004 was 47 million, which was more that tripled the sales in 1999. In terms of Switzerland and Denmark, both of them showed a dramatic upward trend, from 1 million to 5.5 million and from 0.6 million to 4 million, respectively. In comparison with the above-mentioned, the sales in Belgium and Sweden decreased considerably, finishing the period at 1 million and 0.9 million each.
這篇為什麼拿到 7 分(TA 卻只有 6)
Task Achievement 6:方向全對,但沒講規模。這篇的數字全部正確,Overview 的兩個判斷——咖啡全部上升、香蕉除了比利時和瑞典都上升——也都對。問題是它只回答了「漲還是跌」,沒有回答「誰大誰小」。讀完這篇,讀者知道英國咖啡 experienced a biggest growth,也知道英國香蕉 2004 年是 47 百萬,但文章從來沒有說「英國在兩種商品上都遠遠超過其他國家」。這是整張表最搶眼的特徵,卻沒有出現在 Overview。
另外兩個比較細的問題:
- 沒寫出排名變化。1999 年咖啡賣最多的是瑞士(3),英國只有 1.5;到了 2004 年英國衝到 20。這個「後來居上」是很好的細節,但文中只把兩國的變化各自描述,沒有放在一起比較。
- 單位說錯。Switzerland sold 6 million coffee in 2004:表格的單位是百萬歐元,不是六百萬份咖啡。應該寫 sales of coffee in Switzerland reached 6 million euros。開頭的 the income of coffee and bananas 也一樣,表格是銷售額,用 sales 或 revenue 比 income 準確。
Coherence & Cohesion 8:讓這篇拿到 7 分的關鍵。咖啡一段、香蕉一段,段內都是「英國 → 瑞士 → 其他」,按變化大小排序。Conversely, as for the sales in Denmark, Belgium, and Sweden, all of them witnessed a slight increase 把三個小國合成一句,In comparison with the above-mentioned 把下降的兩國跟前面上升的國家對照,段落邏輯非常清楚。這也說明,CC 可以把總分往上拉半分,但 TA 6 是這篇的天花板。
Lexical Resource 7:dramatic upward trend、tripled、finishing the period at 都恰當。錯誤是 which have Fairtrade-labelled(應為 Fairtrade-labelled coffee and bananas)、doubled the amount in 1999(意思對,但 double the amount in 1999 或 twice its 1999 figure 更自然)。
Grammatical Range & Accuracy 7:a biggest growth(應為 the biggest growth)、most of countries(應為 most countries)、more that tripled(that 應為 than)。這些錯誤不影響理解。
四、7 分篇(2):大學生對校園設施的滿意度
題目在考什麼
這題是練習題,我寫在 2024/07/02,是這批作文裡最後一篇小作文,原文記錄用時 20 分鐘(01:12–01:32)、176 字。表格是英國某所大學 2008 年的調查:大學部和研究生對三種設施(社交設施、學習設施、餐廳)分別勾選「非常滿意」「還算滿意」「不滿意」的百分比。
| 設施 | 非常滿意(大學部/研究生) | 還算滿意 | 不滿意 |
|---|---|---|---|
| 社交設施 | 75% / 65% | 20% / 25% | 5% / 10% |
| 學習設施 | 85% / 90% | 8% / 6% | 7% / 4% |
| 餐廳 | 50% / 40% | 35% / 25% | 15% / 35% |
重點:學習設施滿意度最高,社交設施其次,餐廳最低;最搶眼的是研究生對餐廳的不滿意高達 35%,是大學部(15%)的兩倍多,幾乎跟「非常滿意」的 40% 一樣多。
分數卡
原文
以下為送出批改的原始版本,未修改(錯字、文法錯誤都保留)。
The table compares the response of satisfactory regarding schools’ facilities in a British university over the year 2008. Overall, both undergraduates and graduates were satisfied with the study facilities and social facilities. By contrast, the cafeteria had a smaller satisfaction score.
Looking first at social facilities, 75% of undergraduates and 65% of postgraduates felt very satisfied with them. It was followed by 20% college students and 25% of graduate students who rated the facilities “quite satisfied”. The dissatisfied rate was relatively insignificant, with the figure for only 5% and 10%, for undergraduates and graduates, respectively.
Moving through study facilities, most students responsed positively; the figure for both student categories were all more than 85%. In comparison, no more than 10% of questionnaire takers said that they were “quite satisfied” or “dissatisfied”.
However, when it comes to the cafeteria, undergraduates, who were more satisfied with this service, scored 50%, 30%, and 15% on “very satisfied,” “quite satisfied,” and “dissatisfied”, each. As for postgraduates, the trend changed slightly, with 40% said “very satisfied,” 25% reflected “quite satisfied,” and 35% rated “dissatisfied.”
這篇為什麼拿到 7 分
Task Achievement 7:懂得概括,也有比較兩個族群。跟三週前的兩篇比,這篇最明顯的進步是選擇。學習設施那段沒有把六個數字一一列出,而是寫 the figure for both student categories were all more than 85%、no more than 10% of questionnaire takers said that they were “quite satisfied” or “dissatisfied”,用範圍一次帶過四個小數字。這正是我在地鐵那篇問的問題的答案:不是每個數字都要寫,數字很接近、很小的,可以用一個範圍或上限概括。社交設施和餐廳則逐項比較大學部和研究生,讓讀者看到兩個族群的差異。
離 TA 8 還差的地方:
- 一個數字錯。餐廳大學部「還算滿意」我寫 30%,表格是 35%。
- 「超過 85%」不精確。大學部學習設施的非常滿意剛好是 85%,more than 85% 應該改成 at least 85%。
- 最搶眼的對比被輕描淡寫。研究生對餐廳的不滿意 35%,是大學部的兩倍多,我卻寫 the trend changed slightly。這不是 slightly,而且表格沒有時間變化,用 trend 也不恰當。這一點如果放進 Overview(例如「研究生對餐廳的不滿意比例特別高」),TA 就有機會更上一層。
Coherence & Cohesion 8:一個設施一段,排序是社交 → 學習 → 餐廳,最後一段用 However, when it comes to the cafeteria 帶出唯一的負面結果,跟 Overview 的 By contrast 呼應。段內結構一致:先講大學部、再講研究生,讀者很容易對照。
Lexical Resource 7:insignificant、rated、questionnaire takers 有變化,但有幾個用字錯:the response of satisfactory(應為 levels of satisfaction)、responsed(應為 responded)、Moving through(應為 Moving on to)、college students 和 undergraduates 混用。
Grammatical Range & Accuracy 7–8:句型穩定,錯誤少:with 40% said(應為 saying)、the figure for both student categories were(figure 單數應用 was)、over the year 2008(應為 in 2008)。
五、三篇並排比較:表格題怎麼挑重點
回到我當時問的問題:表格數字那麼多,怎麼判斷哪些是重點?把三篇放在一起看,我整理出一個四步驟的方法。
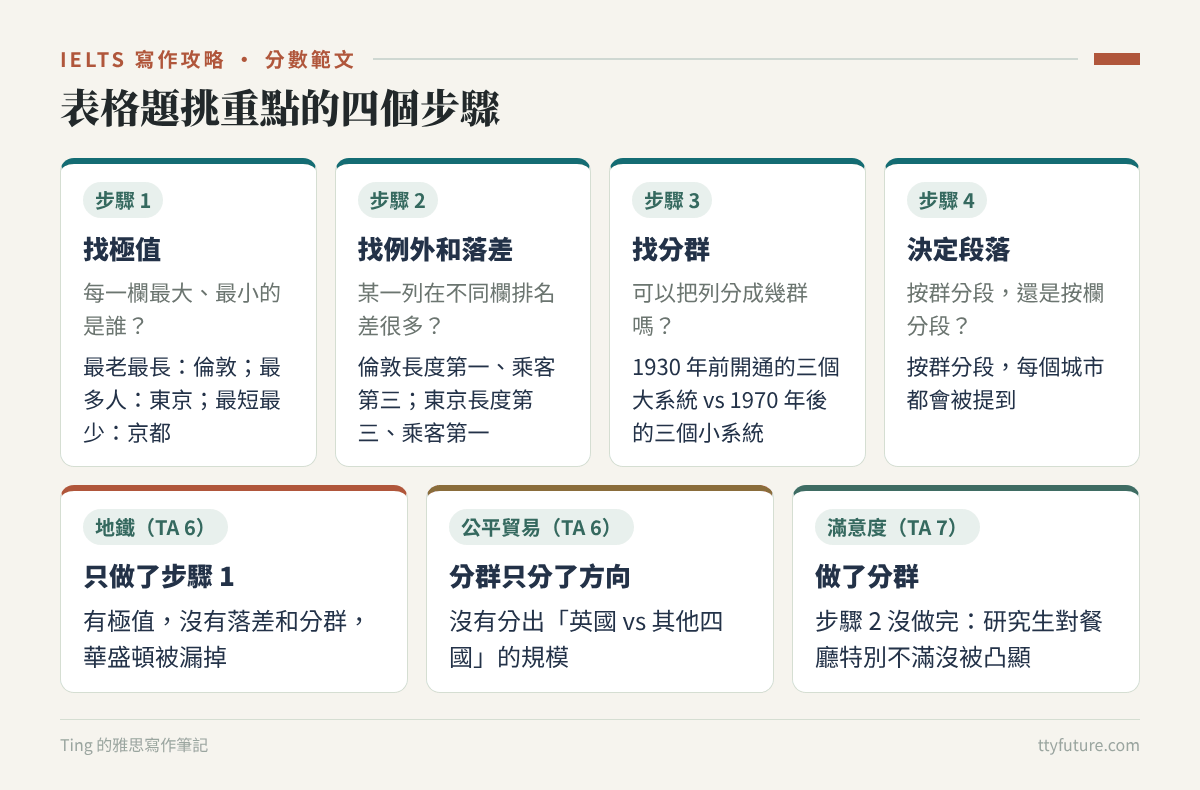
| 步驟 | 要問自己的問題 | 地鐵那篇的答案 |
|---|---|---|
| 1. 找極值 | 每一欄最大、最小的是誰? | 最老最長:倫敦;最多人:東京;最短最少:京都 |
| 2. 找例外和落差 | 有沒有某一列在不同欄排名差很多? | 倫敦長度第一、乘客第三;東京長度第三、乘客第一 |
| 3. 找分群 | 可以把列分成幾群嗎? | 1930 年前開通的三個大系統 vs 1970 年後的三個小系統 |
| 4. 決定段落 | 按群分段,還是按欄分段? | 按群分段,每個城市都會被提到 |
用這個方法回頭看三篇:
- 地鐵那篇只做了第 1 步,所以有極值、沒有落差、沒有分群,華盛頓也因此被漏掉。
- 公平貿易那篇做了「方向」的分群(上升、下降),但沒有做「規模」的分群(英國 vs 其他四國),所以 Overview 少了最大的特徵。
- 滿意度那篇做了分群(滿意度高的兩種設施 vs 餐廳),也開始用範圍概括小數字,但第 2 步沒做完,研究生對餐廳特別不滿的落差沒有被凸顯。
表格題的段落安排
| 分段方式 | 適合的情況 | 風險 |
|---|---|---|
| 一欄一段 | 欄數 2–3 個,而且欄之間沒有明顯關聯 | 容易變成三段各自列舉,漏掉中間的列 |
| 一群一段(按列分群) | 列可以明顯分成兩、三群 | 要確保每一群的特徵在主題句講清楚 |
| 一個表一段 | 題目給兩個表(例如咖啡、香蕉) | 記得在 Overview 或段內做跨表比較 |
六、改寫示範:把地鐵那篇的 Overview 和 Body 重寫
我選地鐵那篇示範,因為它最能展示「挑重點」的差別。以下標註「改寫示範」,是這次整理時新寫的版本,用上面的四步驟重新安排。
改寫示範|開頭+Overview
The table compares the underground railway systems in six cities in terms of their opening dates, route lengths and annual passenger numbers.
Overall, London’s underground is the oldest and by far the longest, whereas Tokyo’s carries the largest number of passengers. It is also clear that the three systems opened after 1970 are much less used than the three older ones.
改了什麼:第一句保留原本正確的極值(倫敦最老最長、東京最多人),但用 whereas 把兩者放在對比的位置,暗示「最長不等於最多人」。第二句換成分群的結論:1970 年後開通的三個系統(華盛頓、京都、洛杉磯)乘客都遠少於三個老系統。這樣華盛頓一開始就被涵蓋進來了。
改寫示範|Body 1(三個老系統)
The three oldest systems, in London, Paris and Tokyo, all opened between 1863 and 1927 and are also the three busiest. Tokyo’s network is used by 1,927 million passengers a year, followed by Paris with 1,191 million. Interestingly, although London has the longest route, at 394 kilometres, it carries only 775 million passengers, fewer than both Paris and Tokyo, whose networks are much shorter, at 199 and 155 kilometres respectively.
改了什麼:不再一欄一段,而是把三個老系統放在同一段,同時講開通、長度、乘客三欄。主題句先說明「為什麼它們放在一起」(最老、也最忙),接著寫最重要的落差:倫敦最長卻不是最多人。原本被跳過的倫敦乘客數 775 補上了,東京的長度 155 也補上了。
另一段 Body 則寫三個新系統:華盛頓 1976 年開通、126 公里、每年 1.44 億人次,雖然長度接近東京,乘客卻不到東京的十分之一;京都(1981 年,11 公里,4,500 萬人次)和洛杉磯(2001 年,28 公里,5,000 萬人次)規模更小。兩段寫完,六座城市十八個數字幾乎全部用上,但讀起來不是流水帳,因為每個數字都在支撐一個比較。
七、表格題可以直接帶走的句型與檢查清單
表格題常用句型
| 用途 | 句型骨架 | 注意 |
|---|---|---|
| 跨欄落差 | Although A has the longest …, it carries only …, fewer than B. | 表格題最值得寫的句子 |
| 分群主題句 | The three oldest systems, in A, B and C, are also the three busiest. | 主題句說明分群理由 |
| 概括小數字 | No more than 10% of respondents were dissatisfied. | 數字小又接近時用 |
| 範圍 | The figures ranged from [x] in A to [y] in B. | 取代逐一列舉 |
| 規模 | A’s sales were more than three times those of B. | 不要只講漲跌方向 |
| 後來居上 | Although B led in 1999, A had overtaken it by 2004. | 兩個年份的表格好用 |
| 倍數差異 | The proportion for A (35%) was more than double that for B (15%). | 別用 slightly 帶過 |
✓ 自我檢查清單
- ☐ 每一列(城市、國家、族群)在文章裡至少出現一次
- ☐ Overview 除了方向(漲跌),也有講規模(誰遠遠領先)
- ☐ 找過「某一列在不同欄排名差很多」的落差,並寫進 Body
- ☐ 分段方式有理由,主題句說明了為什麼這幾列放在一起
- ☐ 數字小又接近的,用範圍或上限(no more than、ranged from)概括
- ☐ 單位寫對:百萬歐元、百萬人次、百分比,不要寫成 6 million coffee
- ☐ 沒有時間的表格用現在式,有年份的用過去式
- ☐ more than、at least、nearly 跟實際數字對得上
練習
- 用第五節的四步驟,把公平貿易那篇的 Overview 改寫成「方向+規模」兩句。
- 把滿意度那篇的 Overview 加上一句研究生對餐廳不滿的對比,並把 the trend changed slightly 改成正確的比較句。
- 隨便找一題表格題,限時三分鐘只做一件事:圈出每欄極值,再找一個「排名落差最大」的列。做完再開始寫。
我當時問「重要數據怎麼挑」,三週後的滿意度那篇,已經看得到一部分答案:數字接近就概括、族群之間要比較。現在回頭看,最後一塊拼圖是「跨欄落差」。表格題不是要你把表格翻譯成英文,而是要你告訴考官:這張表裡最值得注意的是什麼。
延伸閱讀
IELTS 寫作攻略導覽 · 分數範文(第 4 / 19 篇)
← 上一篇:6.5 · 7|圓餅圖:差在 Overview 說得清不清楚
下一篇 →:6.5 · 7|綜合圖:長條圖+表格、圓餅圖+長條圖差在哪?
✦ Target Your Future
有些日子,明明練了很久,成績卻還停在原地。希望這篇筆記能讓你知道,備考路上遇到挫折並不孤單。一次次重聽的錄音、改過的作文、終於敢說出口的句子,都是你已經走過的路。
把這些經驗寫下來,是想陪下一個正在準備的人少繞一點路。你不必照著我的方法前進,只需要慢慢找到適合自己的節奏。累的時候可以休息,再回來做今天能完成的一小步。
願你最後帶走的,不只是成績單上的數字,還有更相信自己、敢往世界走近一點的勇氣。
— Ting
← 回到 IELTS 備考筆記
Leave a Reply