
這篇筆記: 先用一張表看懂三篇長條圖差在哪,再逐句對照我 TA 5 的美國家庭年收入原文:類別名稱寫錯、數字偏差、kept increasing 接在下降後面。
長條圖 6 · 6.5 · 7.5 分|共 3 篇
- 1. 先看結論與 6 分篇拆解(你正在讀)
- 2. 6.5 分與 7.5 分範文拆解
- 3. 並排比較、改寫與檢查清單
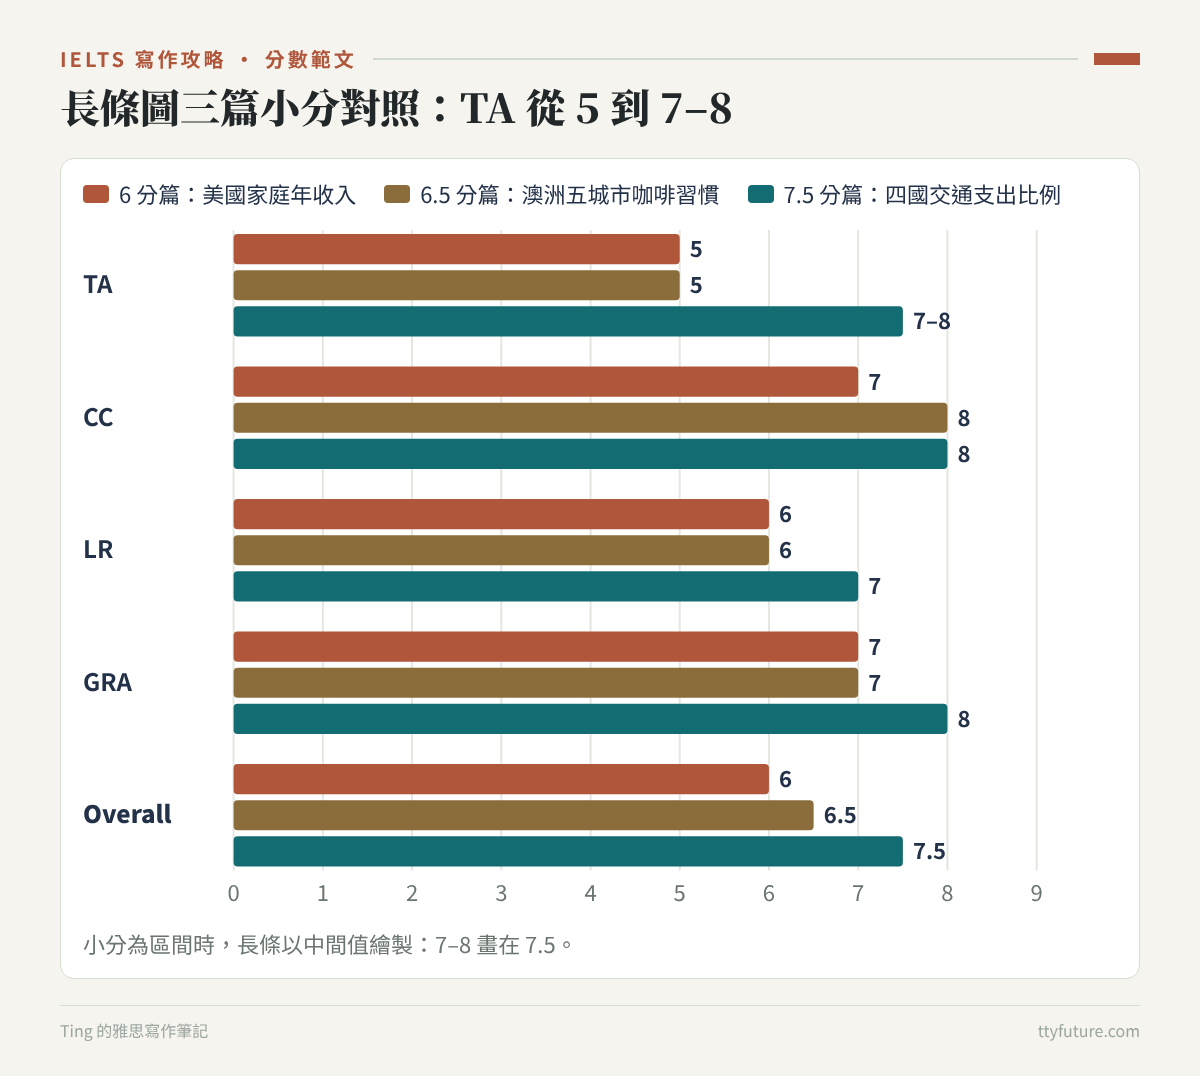
這三篇長條圖剛好是我密集練習一個月的頭、中、尾:第一篇寫在 2024/05/26,總分 6;第二篇 06/01,總分 6.5;第三篇 06/29,總分 7.5,是我這批作文裡小作文最高分的一篇。
看到前兩篇 Task Achievement(TA)只有 5 分,直覺會以為是 Overview 出了問題,因為大家都說「沒有 Overview,TA 最多 5 分」。但重新對照圖表之後發現,這兩篇的 Overview 其實大致正確,尤其是咖啡那篇,Overview 一句都沒錯。真正的問題在 Body:刻度讀錯 10 個百分點、同一段裡數字自相矛盾、類別名稱寫錯、整個城市被漏掉。
這是長條圖最容易踩的坑。長條圖不像圓餅圖把數字標在圖上,你要自己對刻度估讀;長條又多,很容易看錯排、漏一根。TA 看的是整篇對圖的描述是否準確、完整,不是只看 Overview。下面三篇原文都原封不動貼出,保留錯字與文法錯誤;分數原因是我自己對照 IELTS 公開評分標準(band descriptors)的分析。
一、先看結論:三篇長條圖差在哪
| 比較項目 | 6 分篇(TA 5) | 6.5 分篇(TA 5) | 7.5 分篇(TA 7–8) |
|---|---|---|---|
| Overview | 有寫排名,沒寫變化 | 完全正確 | 主趨勢正確清楚 |
| 數字準確度 | 多處差 1–2 百萬,年份打錯 | 刻度讀錯 10 個百分點,同段自相矛盾 | 只有兩個小數字差 1 |
| 類別名稱 | 「少於 25,000」寫成「25,000」 | 正確 | 正確 |
| 涵蓋度 | 五組都有寫 | 兩個城市在某些項目被漏掉 | 四國、四個年份全部寫到 |
| 比較的說法 | kept increasing 接在下降後面,邏輯不通 | 宣稱某項差距較小,但其實一樣大 | 按「走勢相似」分組,比較有根據 |
對照評分標準,TA 5 的特徵是:關鍵特徵有提到,但涵蓋得不充分,而且描述可能不準確。很多人只記得「沒 Overview 就 5 分」,卻忽略了後半句——Body 錯得夠多,一樣是 5 分。
二、6 分篇:美國家庭年收入分布(TA 5)
題目在考什麼
這題出自劍橋 18 Test 2,我寫在 2024/05/26,原文沒有記時間,正文大約 220 字。圖表是美國 2007、2011、2015 三個年份,按年收入分成五組的家庭數量(單位:百萬戶)。五組分別是:少於 25,000 美元、25,000–49,999、50,000–74,999、75,000–99,999、100,000 以上。
| 收入組 | 2007 | 2011 | 2015 | 特徵 |
|---|---|---|---|---|
| 少於 $25,000 | 約 25 | 約 29 | 約 28 | 2011 年上升,之後小降 |
| $25,000–49,999 | 約 27 | 約 30 | 約 28.5 | 同上,2011 年是五組最多 |
| $50,000–74,999 | 約 21 | 約 21 | 約 21 | 三年幾乎不變 |
| $75,000–99,999 | 約 14.5 | 約 14 | 約 15 | 三年都最少 |
| $100,000 以上 | 約 29.5 | 約 28 | 約 33 | 2007、2015 年最多;2011 年小降,之後大幅上升 |
這張圖的關鍵:最高收入組在 2007 和 2015 年都是最多的,但 2011 年被兩個最低收入組超過;兩個低收入組 2011 年增加、2015 年小降;中間兩組相對穩定,75,000–99,999 一直最少。
分數卡
原文
以下為送出批改的原始版本,未修改(錯字、文法錯誤都保留)。
The bar chart illustrates the comparisons regarding the household annual income in US over the years 2007, 2011, and 2015. Overall, it is clear to see that households with more than $100,000 annual income were higher than all the other groups except 2011. In contrast, households in $75,000-$99,999 salary group were the least in all sample years.
As regards households in less than $74,999, both of households in $25,000 and $25,000-$49,999 income group showed a similar trend. Starting at 25m and 26m respectively in 2007, both of them grew in 2011, with 29m and 30m respectively. By 2015, they had decreased slight to roughly 27m and 28m in 2015. Regarding households which earn between $50,000 and $74,999, households with income around $50,000-$74,999 were essentially constant in all three years, with the number in the range between roughly 20.5 millions and 21 millions.
With regard to households above $75,000, the figure for households earn around $75,000-$99,999 began at nearly 14.5m in 2017, dipped slightly to 14m in 2011 and then recovered, finishing the period at 15m in 2015. Additionally, as for the households earned more than $100,000, starting with the biggest income group with approximately 29m in 2007, the number witnessed the downward trend to nearly 27m in 2011 and kept increasing considerably to the level of about 33m by 2015.
這篇為什麼拿到 6 分
Task Achievement 5:Overview 只寫排名,Body 數字和類別多處不準。Overview 寫 households with more than $100,000 annual income were higher than all the other groups except 2011、households in $75,000-$99,999 salary group were the least in all sample years,兩句都對。但它只講了「誰最多、誰最少」,沒有講這張圖最值得說的變化:最高收入組 2015 年大幅增加、兩個低收入組 2011 年增加。這是一張有三個年份的圖,Overview 完全不提時間變化,就少了一半的重點。
Body 的問題則是累積型的,一個一個看都不大,加起來就讓數據變得不可靠:
| 原文寫的 | 圖上大約 | 問題 |
|---|---|---|
| households in $25,000 | 少於 $25,000 | 類別名稱錯,讀者會以為是「剛好 25,000」 |
| $25,000–49,999 組 2007 年 26m | 約 27 | 差 1 百萬 |
| 兩個低收入組 2015 年 roughly 27m and 28m | 約 28 和 28.5 | 都偏低 |
| began at nearly 14.5m in 2017 | 2007 年 | 年份打錯,圖上沒有 2017 |
| 最高收入組 2011 年 nearly 27m | 約 28 | 差 1 百萬 |
| witnessed the downward trend … and kept increasing considerably | 先降後升 | 前面在降,後面不能說 kept increasing |
另外,開頭 the comparisons regarding the household annual income 把題目改寫成「家庭年收入的比較」,但這張圖比的是「各收入組有多少戶」,不是收入多少。這個改寫從第一句就讓考官覺得我沒有抓準圖表在量什麼。Overview 的 households … were higher 也是同樣的問題:家庭不會「比較高」,是家庭數量比較多。
Coherence & Cohesion 7:分段合理,但有重複和邏輯斷點。把五組分成「75,000 以下」和「75,000 以上」兩段,是合理的分法。扣分的地方是第二段 Regarding households which earn between $50,000 and $74,999, households with income around $50,000-$74,999 were essentially constant,同一個類別在一句裡講兩次;第三段 kept increasing 跟前文矛盾。
Lexical Resource 6:類別的稱呼方式太少、不精準。這篇 LR 是 6,是三篇裡最低的。原因很具體:五個收入組,我反覆用 households in …、households with income around …、households earn around …、salary group 來稱呼,其中 around 用在一個區間上不精準,salary 也不等於 income。長條圖的類別往往名字很長,能不能用多種準確的方式指稱類別(例如 the lowest-income bracket、households earning between … and …、the top income group),本身就是 LR 的考點。另外還有 decreased slight(應為 slightly)、the downward trend(應為 a downward trend)。
Grammatical Range & Accuracy 7:有分詞構句、關係子句,錯誤主要是 households earn around … 少了 -ing 或 who、20.5 millions 多了 s。
繼續讀 · 第 2 / 3 篇
IELTS 寫作攻略導覽 · 分數範文(第 2 / 19 篇)
← 上一篇:6 · 7|折線圖:差在趨勢有沒有讀對
下一篇 →:6.5 · 7|圓餅圖:差在 Overview 說得清不清楚
✦ Target Your Future
有些日子,明明練了很久,成績卻還停在原地。希望這篇筆記能讓你知道,備考路上遇到挫折並不孤單。一次次重聽的錄音、改過的作文、終於敢說出口的句子,都是你已經走過的路。
把這些經驗寫下來,是想陪下一個正在準備的人少繞一點路。你不必照著我的方法前進,只需要慢慢找到適合自己的節奏。累的時候可以休息,再回來做今天能完成的一小步。
願你最後帶走的,不只是成績單上的數字,還有更相信自己、敢往世界走近一點的勇氣。
— Ting
← 回到 IELTS 備考筆記
Leave a Reply